Live More new Guides on the way! Get notified by signing up to CAST's newsletter..

Contributed by

VONNE is a North East England infrastructure organisation. It supports the region’s voluntary, community and social enterprise sector through its projects and services.

Use this Guide if you think your website could be better. It will help you find out how your users experience it and how it could be improved. You can use the data it generates to make the case for a new site and to compare its performance with your old site.

Steps to understanding how people are using your website with Hotjar

Decide to learn more about how people experience your website.

You might want to do this because your website is old and in need of improvement. Or it might be that your site is new and you want to keep improving it. Or you might want to learn more about what people do and don’t do on your site so that you can make the case for funding to redesign it.

Be ready for people’s experiences and behaviour to be different to what you expect.

VONNE's old website homepage

VONNE’s old website was 10 years old and unfit for use. It was inflexible and offered a poor user experience. People had to click around a lot to find useful information. User journeys were unclear and confusing.

VONNE put a case for funds for a new website to their board. After this was approved they decided to review people’s experience of their existing site as a way to inform design decisions about their new site.

VONNE’s concern increased following a survey of their members. They learnt that many members didn’t know about services available to them, even those they needed.

Check if your existing analytics tools are giving you enough insight into people’s behaviour on your site. Do they answer your questions about your site?

Consider also whether your tools:

  • Display data in a way that is easy to understand

  • Take you a long time to understand their data

  • Rely on data skilled staff

There are many alternative analytics tools. Hotjar is one.

You could get free advice from an analytics expert by using Digital Candle.

You could also uncover issues with your site by doing some website usability testing.

VONNE needed a way to:

  • Understand their users’ needs and behaviour so they could design a better site

  • Evidence improvements in website engagement to their board once the new site was operational

They also needed any solution to be usable for staff with low capacity and data experience. This would support legacy planning for managing the site. 

Google Analytics couldn’t give them all the data they needed. It also needed them to know how to analyse different data types together. This would make it more time consuming for staff.

They were recommended Hotjar as an alternative to Google Analytics. They decided to use it because:

  • It displays data in a more usable way than other tools. It uses heatmaps to show people’s scrolling patterns and clickmaps to show clicking activity on a page. 

  • Insights are easy to interpret and require low data literacy

  • It allows you to watch short recordings of your users’ activity on your site. This helps you discover issues within their user journey.

  • It’s easy to install on any website domain

  • It has surveying tools to help you learn more about your users

  • It doesn’t share data with 3rd parties and doesn’t collect any personal information.

“Hotjar’s a really good tool for people who don’t have time or aren’t very data confident.” - Molly Frankcom, Data and Research Officer, VONNE

It’s important to get clear what you want to understand about your users’ behaviour. Do this so that you know what insights you will be looking for in the data Hotjar generates.

Keep your questions simple. Don’t combine questions or try to ask multiple questions in one go.

VONNE wrote research questions for what they wanted to understand. These included:

  1. How can we monitor website use as a way to improve general user experience?

  2. What is the typical user journey to get from Page A to Page B?

  3. Do users frequently perform u turns when trying to fulfil a simple task on our website?

  4. How might we understand if our new homepage is more functional and interactive for users?

HotJar is easy to install. You could do it yourself using their online guide or ask a web developer to do it. It should take them 15 minutes.

You also need to:

  • Check if there are any GDPR risks to using Hotjar. VONNE didn’t find any but you should check it yourself too.

  • Update your privacy policy as Hotjar uses cookies. Users need to agree to cookie collection for Hotjar to track their activity. It won’t track users who don’t accept cookies.

  • Update any other policies on the data you store about people who use your website.

Then decide which pages to monitor. Do this by selecting pages on your Hotjar dashboard.

VONNE asked their web developer to install Hotjar on their existing site. It took them 5 minutes.

They already had a cookie consent banner on their site.

They updated their privacy policy.

They found no significant risk to users’ data from installing Hotjar. Using Hotjar enabled them to remain GDPR compliant.

VONNE then added site pages to monitor via Hotjar’s dashboard.

They decided not to use Hotjar’s pay for survey tool because they already knew there were many problems with the site.

Then they left Hotjar to collect data for a month before they did the next step.

Analyse the heatmaps, clickmaps and other data Hotjar generates.

Look for where people are interacting with a page. Compare this with where they aren’t.

You should also look for:

  • u turns (where they have used the back button)

  • rage clicks (where users repeatedly click a certain area or specific element on your site)

Hotjar suggests other things you can do with your data.

You can also download data as JPEG and CSV files.

Hotjar clickmap showing users' click patterns on VONNE's old site.

After running Hotjar for 1 month VONNE had some useful data to analyse.

They found that people:

  • didn’t scroll below the fold on the homepage

  • didn’t scroll below the fold on many other pages.

  • interacted a lot with the site’s jobs page but not with any other services VONNE offered through the site.

They got lots of other insights too.

They screenshotted heatmaps of relevant pages so they had a record of these to compare with heatmaps of the same pages on the new site.

“HotJar has enabled us to review our website's user experience and functionality. Now we understand better how people are using the site and what needs to be improved.” - Molly Frankcom, Data and Research Officer, VONNE

Share your findings so other stakeholders can understand how people are using your site. This will make it easier for them to support your plan for improving it.

You could take screenshots of Hotjar dashboard views and add them to a slidedeck.

Or you can use the Hotjar dashboard itself to walk people through what you are seeing and learning.

Then show your findings to people in your team who will find it useful. This could include:

  • Communications officer

  • Learning or evaluation staff

  • Your CEO

Explain what you have learnt from the clickmaps and heatmaps. This will make it easier for them to understand what they are looking at.

VONNE shared findings at online team meetings. They showed the Hotjar dashboard via a screenshare and explained what the data meant.

They told the team they would show them the same data views for the new website once it had gone live.

Use your Hotjar insights to help you make decisions about your new website. Think about:

  • Your homepage’s design - above and below the fold (above the fold is the area that shows on screen when a page loads)

  • User journeys - how people get from one place to another on your site to perform a task

There’s many other things to think about too. Use these resources to help you:

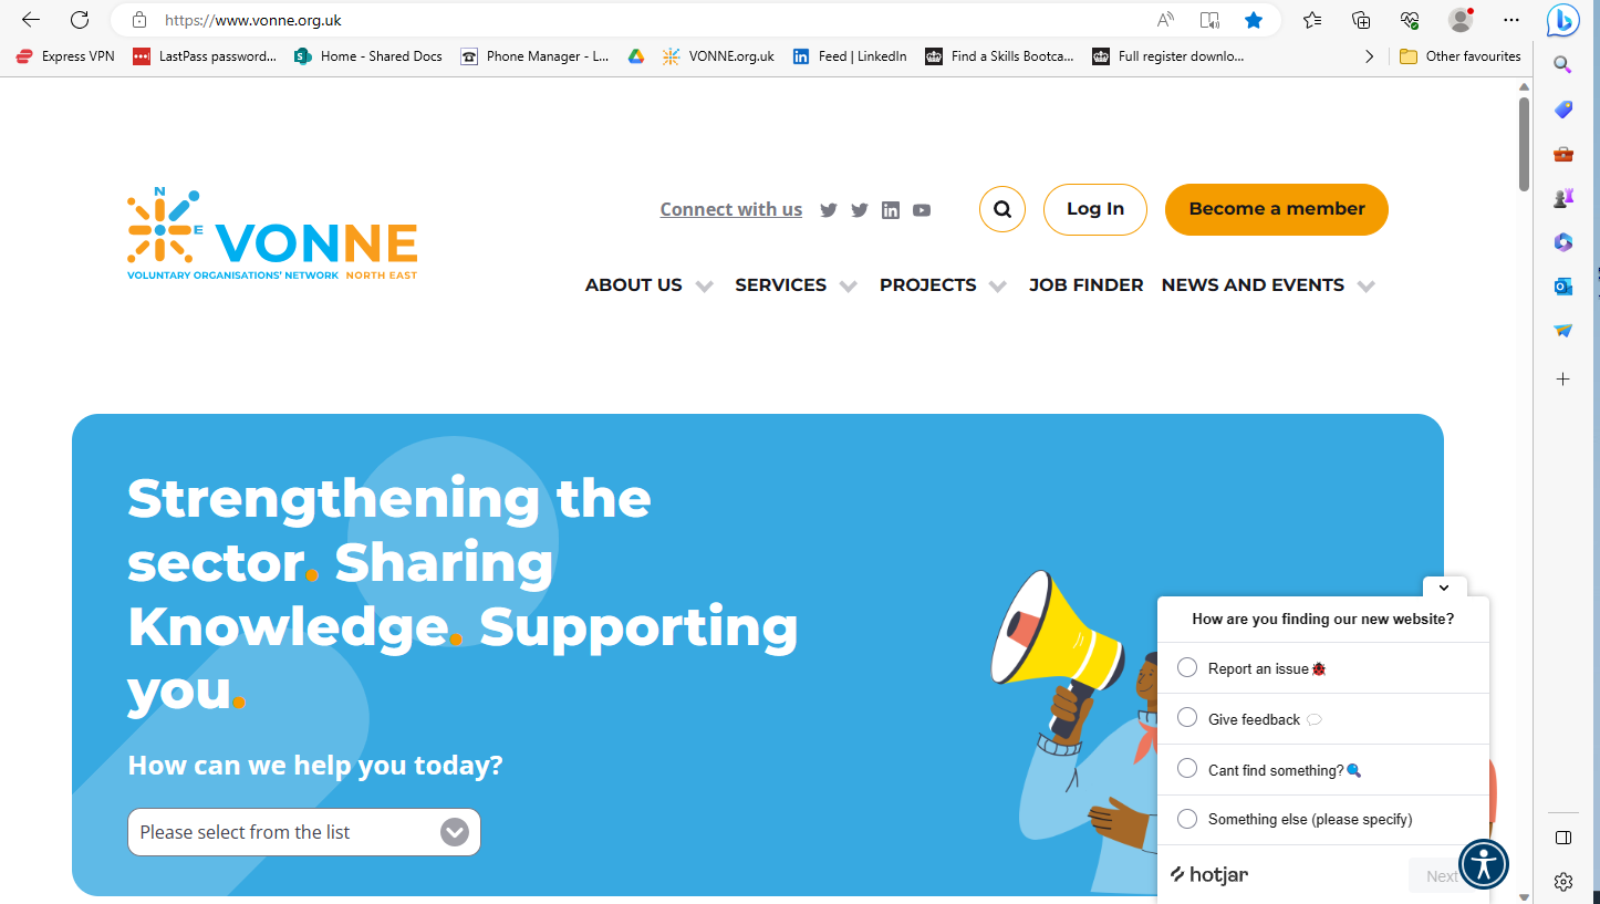
VONNE's new homepage with Hotjar's survey tool now active.

VONNE worked with website design and development professionals to build a new website. They combined the work with a rebrand and integrated the site into their CRM.

Use Hotjar to compare user behaviour between your old and new websites.

To see if user experience has improved compare:

  • Number of interactions with your homepage

  • Interactions with other pages

  • How quickly people get from one place to another on your site

  • U turns and rage clicks

Allow at least a month of tracking in Hotjar.

Make sure you compare data for similar timescales. For example if you do 2 months of data on your new site, compare it with 2 months on your old site.

Hotjar heatmaps showing scroll patterns on VONNE's old and new site. Note how scrolling goes deeper on the new site.

User activity changed a lot on VONNE’s new website. Their journeys and click patterns were very different. People use homepage elements more and user journeys are simpler and quicker. Navigation bar use has reduced as people are using in-page links more.

VONNE also decided to add Hotjar’s pay for survey tool to the new site. They used it to pick up problems more quickly and learn about general sentiment towards the new site.

Further information